


It used to be relatively simple to understand the performance of regional publishers: a/ list the sales of all titles in descending order, b/ analyse the proportions owned by each publisher.
How times have changed! Look at the latest ABCs for the second half of 2016 and there’s an avalanche of statistics: the biggest websites, fastest-growing websites, largest social media handles, fastest-growing social media handles, biggest daily and weekly print sales, and the ‘best declines’ in those print sales.
This, of course, is exactly what advertisers need in today’s fast-changing and fragmenting media world, but it makes it difficult to construct a single ‘league table’ to measure the performance of individual publishers.
And so in an attempt to bring some easy-to-understand order to the marketplace – and for a bit of visual fun – I’ve constructed a unique view of publishers’ ABC statistics in 11 pie charts.
In summary, this suggests Trinity Mirror is out-performing the regional media in total website and social media audiences, with Archant hot on its heels in terms of ‘fastest growth’. (Post-publication note: Not all of Newsquest’s and Johnston Press’ websites and none of their social media followers are ABC audited.)
Meanwhile, Johnston Press is underperforming in daily and weekly print circulations, while Newsquest is out-performing in terms of ‘best declines’ in both daily and weekly publications.
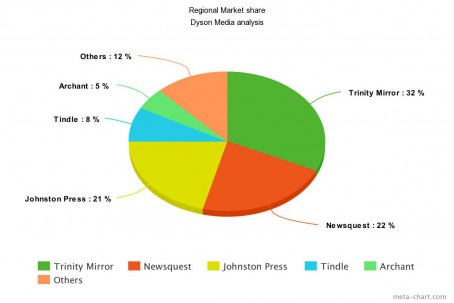
The starting point was to consider publishers’ regional market shares, and although the Media Reform Coalition’s Who Owns the Media report from 2015 had a good stab, there are no accepted figures for this.
This blog directly asked four trusted senior industry sources, and even then the answers differed because they made their estimates based on different criteria – number of titles, circulation, web audience, and so on.
With all that as a huge caveat, my own estimate – which is basically an average of all the above sources – comes out as follows:
With those estimated market shares in mind, I then took the ‘Top 20′ titles from each data area as a snapshot of how publishers are performing.
Pie chart #2 shows Trinity Mirror out-performing the market to dominate the biggest websites with 12 of their titles in the top 20 for the highest ‘daily unique’ visitors:

But look at the figures another way, in terms of ‘fastest-growing’ websites, and pie chart #3 shows that Archant suddenly dominates with 11 in the top 20 – albeit these are relatively tiny websites:

Next up comes social media, and pie chart #4 shows Trinity Mirror running away with 16 of its titles in the top 20 for total Twitter followers. (Remember, Newsquest and Johnston Press could not be included in this or the next three tables because their social media figures are not ABC audited.)

Archant shows its social media progress in pie chart #5 with six of its titles coming second to Trinity Mirror’s nine titles in the top 20 for fastest-growing Twitter followers:

Pie chart #6 is for the top 20 totals of Facebook ‘likes’, and again Trinity Mirror titles massively dominate:

Archant’s determination comes through even stronger in pie chart #7 which sees 14 of its titles in the top 20 for fastest-growing Facebook ‘likes':

The above measurements are important in the modern media world: social media not only tallies ‘likes’ and ‘followers’ but can also tempt readers to become unique visitors to websites.
But care needs to be taken. For example, Trinity Mirror’s latest results revealed that £581 million of revenues still came from print last year, with just £79 million from digital, and other publishers’ proportions are likely to be similar.
Those revenue shares will continue to change, with print revenues declining and digital revenues growing, but the sheer size of print still means that traditional publishing has to be taken seriously.
With that in mind, it’s interesting to see Trinity Mirror out-performing and Johnston Press and Newsquest seemingly underperforming their market shares when it comes to the top 20 daily print circulations, as seen in pie chart #8 (again, note that Johnston Press and Newsquest don’t record ABCs for all its titles):

Pie chart #9 turns things around, with Newsquest out-performing in terms of ‘best declines’ in daily print circulation, with nine of its titles in the top 20:

Trinity Mirror is back on top when it comes to the highest paid-for weekly print circulations in pie chart #10:

But Newsquest comes back into the battle when it comes to ‘best declines for the weeklies in pie chart #11:

It’s encouraging to see a number of independent publishers making the top 20 in all four pie charts covering print circulations, although they all need to put more focus on website and social media.
Who ate all the pies? Well, it was nearly Trinity Mirror running off with the whole tray, but some fine displays from Archant and Newsquest are keeping them on their toes.
There’s another big caveat on all the above which is implicit in my constant reference to the ‘top 20′: I’m sure you could change the pie proportions if you re-analysed the top 50, top 75, etc.
But for me, the top 20 was enough effort, given I’ve got to give myself time to carry on eating real pies ..! Enjoy your slicing …
Many thanks to www.meta-chart.com for the graphics.
 Sign up for our free daily email bulletin
 Follow HTFP on Twitter
So it appears about five pounds in every six in income is PRINT.
The web get rich quick scheme has some way to go it seems.
Report this comment
Isn’t it astounding paperboy that for all the relentless battering that print has taken over the last 15 years that it still financially outperforms digital?
Five pounds in every six in income is print. Surely it should be the other way round by now if all the grand visionaries are to be believed.
Report this comment
The big stat we used to live by was penetration. It’s alright selling 40,000 copies these days – it would make you a top performer – but not in a city of half a million.
Sadly, many once proud regional dailies potentially have upwards of half a million sales, given their old patch boundaries, but sell woefully few.
It’s not all shareholder greed, although I’d blame that for the swingeing cuts in staff and quality.
When I started you still had the big factories, and paper sellers waiting for the gates to open at clocking off time. Mondays and Fridays, for sports coverage, were great days.
We were quicker, too, we reporters, in the days of typewritten paper. The temptation to mess around with intros and stories, and ‘fill’ rather than write, is all too apparent these days. Even cut and paste from social media is poor in terms of speed. The quality is dying as staff numbers endure a last stand and we see an emphasis on clickbait.
We’re strangling the goose and there will be no more golden eggs.
Report this comment
What strikes me from a cursory glance at this chart is how poorly Johnston Press is performing across so many areas in comparison to rival organisations.
Humble pie?
Report this comment
It’s me age!
Dear Steve
Please remind me why some publishers appear on some / all sites yet others don’t ?
There’s some scary stats on there if I’m reading it correctly and much cause for concern with regards to core products and main revenues falling away dramatically, I’m talking paid for copy sales here, online and social media popularity is all lovely and fluffy but I still maintain you can’t spend it, it pays no ages,
Also by ‘ best declines’ does this mean ones who’ve performed best in terms of lack of decline or the ones with the biggest losses?
So many questions but interested to know
Report this comment
Maybe a pie chart of which publisher has despatched most staff in the same time frame?
Report this comment
That’ll be a worrying statistic @paperboy for certain publishers with their ad sales revenue in steep decline and popularity on line being, let’s be honest, fools gold.its a lose lose situation for those putting their faith in a weak digital offering.
I have a friend in business who is a very wealthy man who laughs when I tell him how some publishers( ( mention no names) get excited about their online popularity choosing to ignore the cold hard facts of of their terminal ad and copy sales losses,this from a man who built a business from nothing and through hard work,advertising in print when a local weekly was a credible medium to do so and who now only uses targeted local independent magazines to gain business.
As he says, “show me someone who believes popularity will pay the bills and I’ll show you someone in denial”
Be interesting to see what the shareholders say when online popularity is given as a positive thing yet with revenues down 11.5% year on year meaning no dividend payouts for them this year.
Buckle up its likely to be a bumpy rude chaps
Report this comment
Steve,
Interesting article – but I think it should be made clear that Newsquest’s social media following isn’t ABC-audited. Newsquest would have a number of titles in the top 20 Facebook and Twitter chart if it were (as would Johnston Press).
Thanks
Julian Thorpe
Newsquest Digital
Report this comment
Thanks, Julian Thorpe. I think your point is a fair one and we’ve added post-publication comments in the piece to make that clear. That said, the analysis was clearly stated to be based on ABC figures, and so perhaps your publisher and JP might take that on board. Nevertheless, thanks again. Best wishes, Steve
Report this comment
South side Johnnie: Many thanks for your questions.
1/ You asked ‘why some publishers appear on some / all sites yet others don’t?’. There are two answers: a/ my approach was the ‘top 20′, and so some publishers didn’t make that ranking in some data areas; b/ in certain data areas, publishers don’t record figures via ABC, and we’ve noted this in a post-publication comment in the article.
2/ You asked is ‘best declines’ means those who’ve performed best in terms of lack of decline or the ones with the biggest losses? Your first definition is correct. We mean the ‘best’ in terms of least declines.
Many thanks again, and best wishes, Steve
Report this comment
Thanks very much for your easy to understand explanation Steve , much appreciated and very interesting pie charts and facts
Bit worrying for some if I’m reading it correctly!
Report this comment
Interesting to see Newsquest’s paid for print performance so much better than the others. They appear to take print sales more seriously and I’m told they have a dedicated group that works on it – editorial director and at least one of their mds involved too. Sensible to support print while growing digital. Newsquest also seem to be taking digital subscriptions seriously too, with the Herald doing well with this.
Report this comment
Archant lifer. If these figures are anywhere near correct websites are little more than a sideline, after all the effort and money. Looks bad to me, but no doubt someone can correct those figures if they are wrong. JP does come out too well, but they have always been off the pace digitally.
Report this comment
I meant JP does not, of course.
Report this comment
I think Saddened Journo makes an excellent point.
The paper sales being celebrated by regional dailies need to be seen against the city’s population.
It’s chicken feed in all cases.
Report this comment
Another point, Steve. While TM seems to be performing well in your analysis – ‘Well, it was nearly Trinity Mirror running off with the whole tray, but some fine displays from Archant and Newsquest are keeping them on their toes’ – a look at circulation over a period of time tells a different story.
You edited the Brum Mail at one time, didn’t you?
What was the circulation back then?
Because the decline under TM is shocking. Latest ABC figures show an average sale of 19,200 – down 20.9 per cent.
Wasn’t it a six figure circulation, even with the naughty sales fixing?
And who honestly believes the internet figures of the newspaper groups? I guess they’re harder to police than simple print sales.
Smoke and mirrors, while the fat cat bosses and shareholders get richer and journalism suffers.
Report this comment
Saddened Journo: you ask various questions about the Birmingham Mail (a paper I once edited) and its decline. Can I point you to http://www.holdthefrontpage.co.uk/2015/news/dyson-at-large-9-reasons-why-the-birmingham-mail-is-fighting-for-its-life/
Report this comment
Local news on the web does not work. The proof? Websites are stuffed with stories from the dark side of the moon, nothing to do with the patch. These are desperate days for the click baiters I fear. Just about anything will do, as long as it gets a hit.
Report this comment